Who’s behind the wheel? Driving license trends and penalty points across the UK
01 Apr 2025 | by Chris Roe
6 min read
It’s reported that UK roads are the sixth safest in the world. However, there are plenty of drivers that rack up those penalty points, which perhaps prevents us from breaking the top five. As of February 2025, there were over 42.5 million licensed drivers on UK roads. Using the graph below, we can see that, across all age groups, men (22.7 million) outnumber women (19.7 million) in holding full driving licenses. The gender gap in license ownership is smaller for younger drivers but widens significantly with age, and license ownership peaks around age 60 (876,329) before dropping sharply at 70+ (483,076), likely due to renewal requirements.
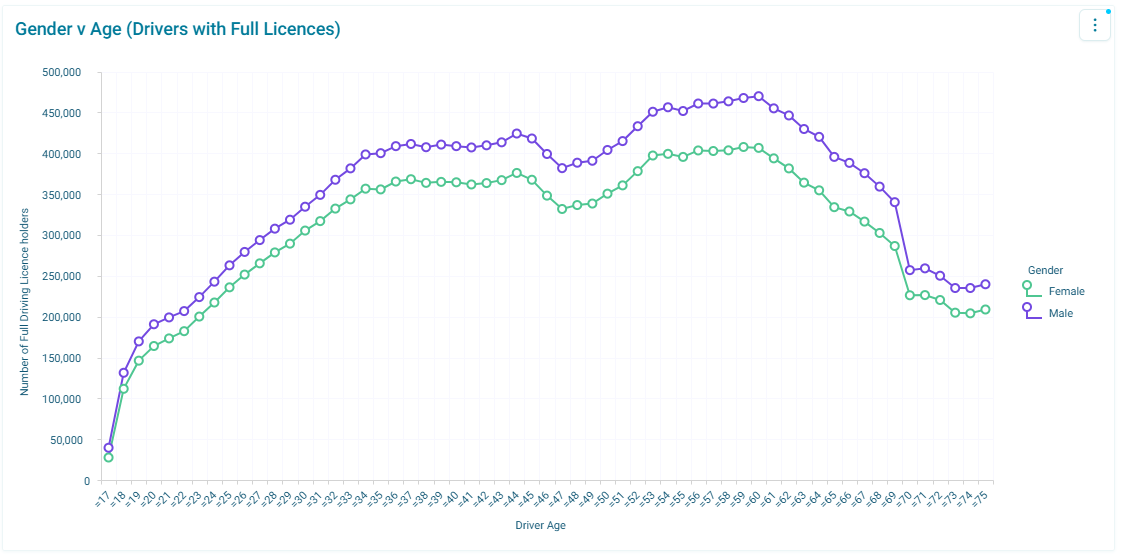
Data visualisation was created using Apteco software.
So, while more male drivers are on the roads, does this also mean they take more risks and therefore have more penalty points than other demographics?
To answer this, we’ve taken an in-depth analysis of the latest government data on license holders and penalty points, revealing key insights into who holds the most points and where the highest concentration of driving offences happens.
Data collection
The dataset, published by the Department for Transport, provides comprehensive insights into current driving license holders across the UK. Periodically updated, this dataset dates back to 2012, but for this analysis, the focus is on the February 2025 release, which best reflects present-day driving behaviours and licensing trends across the UK. Our data analysis and visualisations have been produced using Apteco’s data insights platform.
Penalty points: Who’s breaking the rules?
Penalty points are issued to drivers for various motoring offences, such as:
- Speeding
- Driving under the influence
- Failing to comply with traffic signals
- Reckless or dangerous driving
- Ignoring signs and traffic signals
- Driving an uninsured vehicle
- Using a vehicle with defective steering
- Failing to stop after an accident
Some of the most common violations leading to penalty points include exceeding speed limits, using a mobile phone while driving and dangerous driving. A closer look at the dataset reveals which groups are most likely to commit an offence which results in penalty points.
Male drivers of all ages are almost twice as likely to have penalty points

Data visualisation was created using Apteco software.
What the data definitively shows us is that for almost all age ranges, male drivers are at least twice as likely to have penalty points on their licence as female drivers. Secondly, it also shows us that as we go down towards the age of 17, the rate goes much higher. Over 150,000 male drivers between the ages of 17 and 25 already have points on their licenses, with 25 being the peak age for penalty points. It’s important to note here, that for less serious issues, points will remain on licences for 4 years so drivers aged 25 could have acquired these points at any given time in the previous 4 years.
Gender split: Young drivers (17-25) and penalty points
The table below highlights a clear disparity between young male and female drivers, with the gap being most pronounced at the youngest driving ages and narrowing as age increases. However, the dataset does not provide insight into the reason behind this difference - it could result from variations in driving behaviours, how often they drive or other factors.
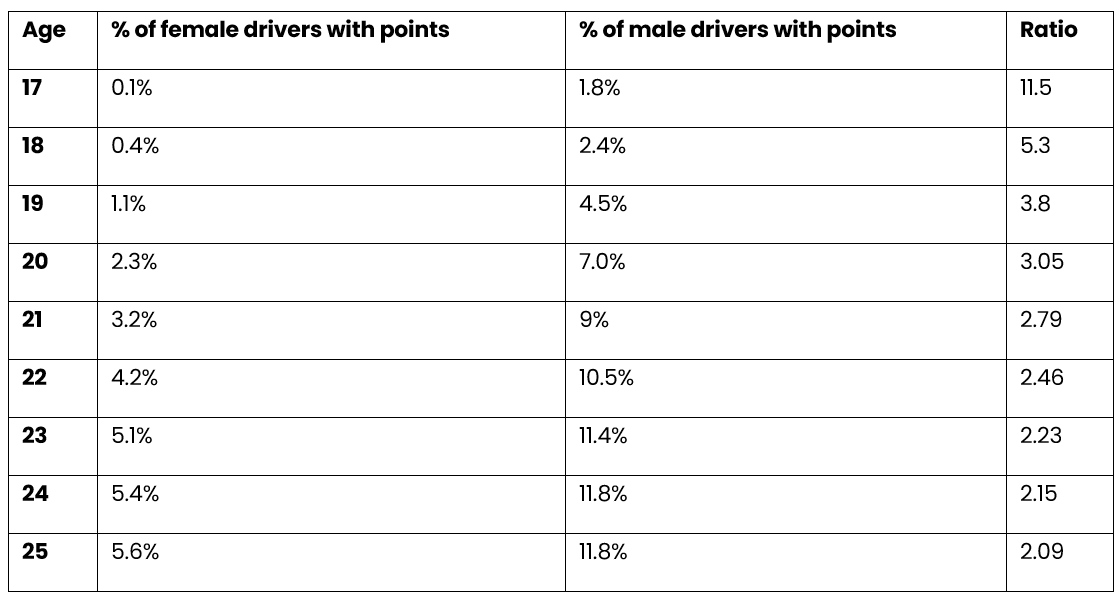
Additional data from Brake.org revealed why young drivers are more likely to be high-risk. Peer pressure plays a major role in risky driving, and the riskier someone drives, the more points they’re likely to accumulate. This also means that younger drivers are more likely to be involved in a collision as a result of speeding. This is particularly true when it comes to fatal accidents, with far more young male drivers losing their lives to a speed-related crash than female drivers. Unfortunately, this shows the reality of just how impactful taking risks can be not just for the driver, but their passengers, other drivers and pedestrians.
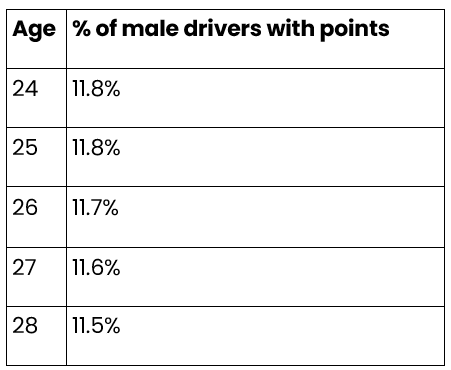
When looking at the most common age of male drivers with points, there’s a clear trend that those in their 20s have more offences recorded than any other age group.
The most common age of male drivers with points
Female drivers peak later for penalty points
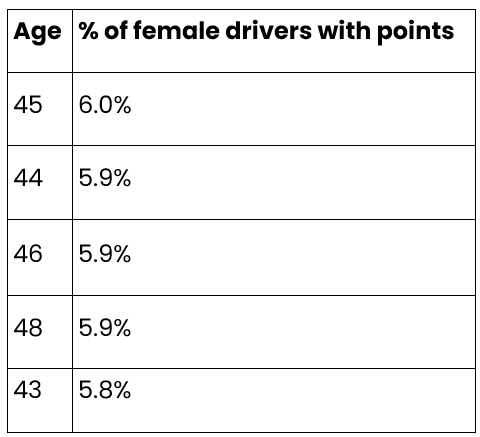
Female drivers peak much later than male drivers, with the most common age for points being 45 (6%). When looking at direct comparisons between other ages, 5.6% of females aged 30 have points vs 11.4% of males aged 30 - over double.
While the most common age for men accumulating points is in their 20s, the most common age for females is in their 40s, suggesting a notable difference in driving behaviours across genders and age groups.
The most common age of female drivers with points
Older drivers: A drop and an odd jump
There are also more than half a million drivers over the age of 60 with points on their licence, but then we see a huge drop off in the accumulation of penalty points, especially among male drivers. We should note that this data only tells us that a person has a driving licence, not that they actually drive. So it could be that older age drop-offs have to do with less driving.
Insurance data suggests that older drivers are seen as less of a risk because they have more experience, and are less likely to speed and use devices while driving. This means drivers over 60 generally pay less for their insurance cover.
The number of 70-year-olds with a driving licence drops dramatically as the law requires people to renew their licences. This then means that while the total number of drivers of that age with points is less than 69-year-olds, the percentage increases because there are far fewer registered drivers.
Where are the worst drivers in the UK?
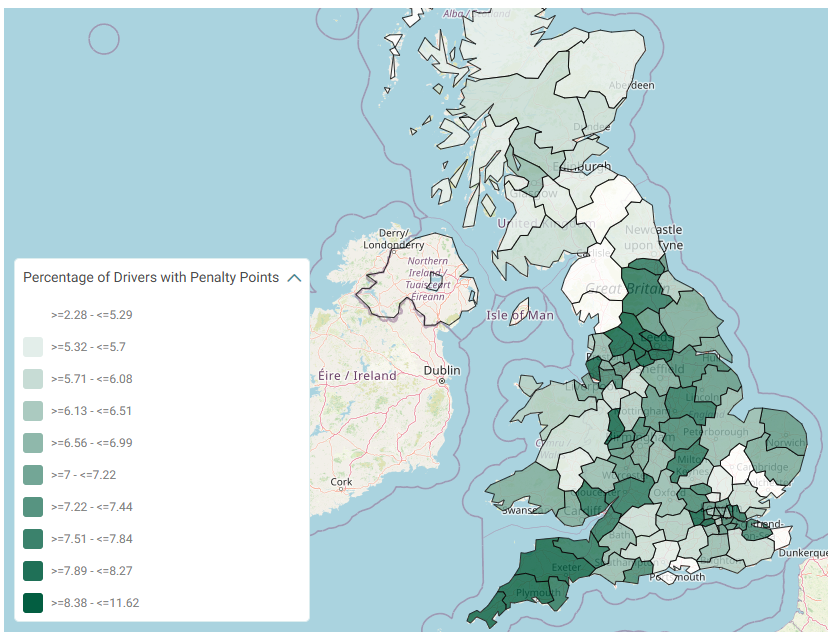
Data visualisation was created using Apteco software.
Regional breakdown: The UK’s best and worst drivers
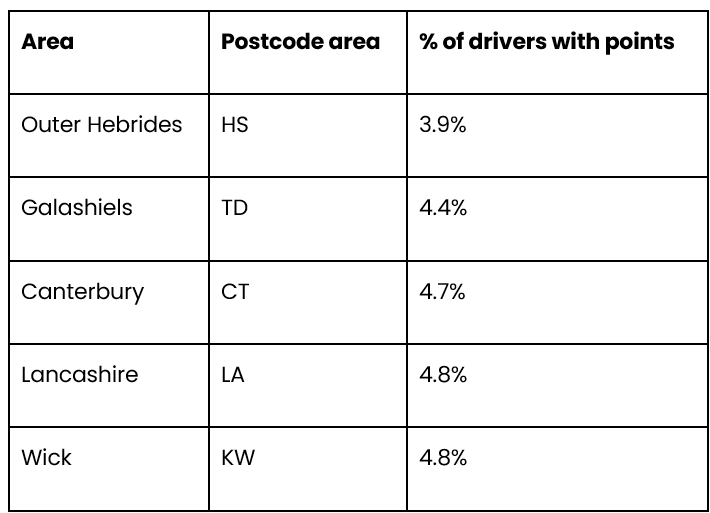
The top 5 postal areas with the best drivers
Ranking as the area with the best drivers is the Outer Hebrides, based in Scotland, with just 3.9% of drivers having points on their licenses. In second place is Galashiels with 4.4% and in third Canterbury with 4.7%. Scotland as a whole has a percentage of drivers with less penalty points. This could be down to them being better, or a lack of police officers, or a difference in the way traffic offences are decided on.
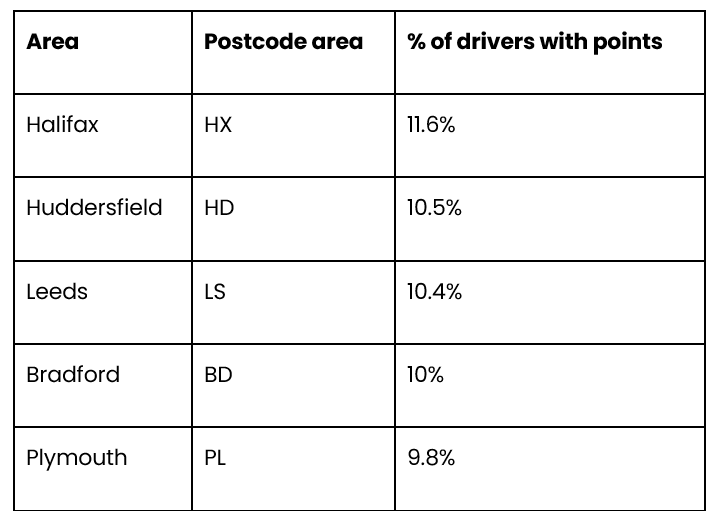
The top 5 postal areas with the worst drivers
When looking at the UK’s worst postal areas for drivers, the data shows that Halifax has 11.6% of drivers with penalty points, Huddersfield has 10.5% with penalty points and in third Leeds has 10.4% with penalty points.
The South West of England also has a high percentage (e.g. TR, PL, EX) compared with geographically similar areas such as the Lake District (e.g. CA, LA). These are by and large rural areas with a high influx of tourists each year, but there is a definite disparity in percentages.
Conclusion
The data presents a clear picture of UK driving trends and risk-taking behaviours. While male drivers hold more licenses, they also accumulate more penalty points, particularly younger males under 25. Female drivers, on the other hand, demonstrate steadier and safer driving habits in general.
Geographically, certain cities and districts have a higher concentration of drivers with penalty points, with Halifax and Huddersfield topping the list for the highest percentage of offenders. Meanwhile, Scottish drivers emerge as the most law-abiding road users, which is needed for navigating those winding Highlands roads.
Understanding these trends can help policymakers, insurers and road safety organisations develop targeted strategies to improve driving standards across the UK.
March 2025: This data was collected from the Department for Transport’s Driving Licence Report, and uses Apteco’s data insights platform Orbit to highlight key trends and analysis while producing clear graphics to demonstrate findings.
